
The Stock Market Reality
When I first opened a stock trading account with Charles Schwab back in early 1990, I was excited at the prospect of making millions of dollars. There was explosive growth within the stock market which helped Charles Schwab become the largest discount stockbroker in the U.S and largest provider of online brokerage services. So who wouldn’t be excited to participate in one of our history’s investment boom with great macroeconomic importance? Every financial publication, news channel, guru, and financial planner promoted the same charts and the same mantra: stocks go up over time. The dips are only temporary, but overall, you can expect a 10% return annualized over a 10-year period. Figure 1 is the typical chart that we are all accustomed to: S&P 500 index from 1925 to 2006.
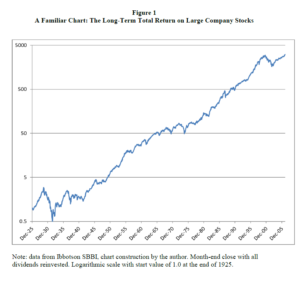
NOTE: data from Ibbotson SBBI, chart construction by Professor Edward F. McQuarrie of Santa Clara University. Month-end close with all dividends reinvested. Logarithmic scale with a start value of 1.0 at the end of 1925.
A research paper written by Professor Edward F. McQuarrie of Santa Clara University depicts an alternate reality. If we zoom out to 1919 and index the chart for inflation, we see a vastly different chart.
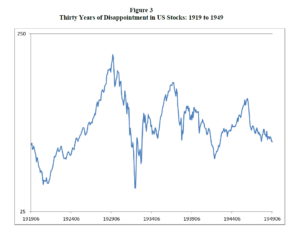
Note. Cowles’ (1938) All Stocks price index chained to Ibbotson SBBI large company stock price index, deflated by Officer and Williamson (2017) before 1926 and the Consumer Price Index after. The Cowles data for this chart from 1919 to 1926 are based on the Standard Statistics Services index (a corporate predecessor of the Standard & Poor’s company); the SBBI data from 1926 are based on a predecessor to the S&P 500 (see Wilson and Jones 2002). Data from the named sources, chart construction by Professor Edward F. McQuarrie of Santa Clara University. Month-end close with all dividends reinvested. Logarithmic scale with a start value of 1.0 at the end of 1925.
This is the chart that no one wants you to see. First, we notice that the lows of 1932 were not a one-off event as there was another low of the same degree in 1921. The drop in the stock market in 1931 just canceled the boom in the market of the 1920s.
Now, if we take the original chart and compare it to an inflation-adjusted return within the same period, we see a clearer picture.
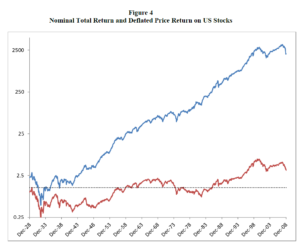
Note. Monthly total return and price return are from the Ibbotson SBBI, as is the Consumer Price Index data used to deflate price return (total return line shows nominal total return). Dotted line shows the (deflated) closing price for August 1929. Start value set at 1.0 in December 1925 for the total return line (off-chart, see Figure 1), and in December 1928 for the deflated price line, to obtain some visual separation in the early years. Calculations and chart construction by Professor Edward F. McQuarrie of Santa Clara University.
By looking at the first chart and listening to conventional wisdom, you will be told that an investor who purchased stocks at the height of the market in the 1920’s and reinvested dividends will grow an initial investment of $10,000 into about $9.3 million! However, when adjusted for inflation and dividends are spent, as a retired person might have to do, then the $10,000 returns only $33,000. 1.5% vs the 9% compounded!
Now, I am not suggesting that the stock market is all bad. Keep in mind that these charts reflect the investment into the Standard and Poor’s 500 (S&P 500) which is a broad index for tracking the performance of 500 large companies listed on stock exchanges. Successful fund managers like Peter Lynch and Warren Buffett have made billions carefully studying and developing methodology for evaluating value stocks and investing in the stock market. The key is that they don’t invest in broad funds or aimlessly throw darts at a board. They understand and invest in individual companies and the businesses behind them. They evaluate and calculate the intrinsic values of those businesses and buy stocks based on a discounted price of the intrinsic value. Even then, most fund managers pick 1 good stock out of 10. Buffet’s record is 5 good stocks out of 10.
If you can beat that, you can beat Buffett.
In closing, I’d like to end with Warren Buffett’s two rules of investing…
Rule No. 1: Never lose money.
Rule No. 2: Never forget rule No.1
Rule No. 3: Remember that the stock market is a manic depressive.
If you follow financial or investment news outlets, you have learned this to be true where markets fluctuate wildly depending on what small to large scale events are influencing them. Its easy to become over consumed with mania. So, I suggest to try to stay rational, do your due diligence, and plan!
If you don’t have the appetite for that and find your fund manager is not producing the returns, you’re looking for then it’s worth reevaluating your game. If you’re just keeping pace with inflation and want to explore other ways to diversify your investment portfolio or get started on a different path, then it’s time to take a look into investing in real estate.
Leave a Reply